NEW:
ADVANCED
TRADESTATION TECHNIQUE
Keltner Channels
Omega's definition: The Keltner Channel indicator is used to identify overbought / oversold conditions as well as the trend strength of a market. When an assetís price is closer to the upper band than the lower band, the market is considered overbought. Conversely, when an assetís price is closer to the bottom band than the upper band, the market is considered oversold. An advantage of Keltner Channel analysis compared to other indicators used to analyze trend strength is that market lag is not as pronounced because Keltner Channels are extremely sensitive to fluctuations in volatility. {** © 1987-1999 Omega Research, Inc. **}
Well, it can certainly make sense, but at the same time, there are so many of them, since the good old Bollinger Bands, which make more sense than money...
Our Keltner Channels indicator is based on the same principle, but is more responsive thanks to the VAXMA, replacing a simple moving average in the original indicator. A too slow moving MA makes prices hit the bands too quickly, hence generating false signals.
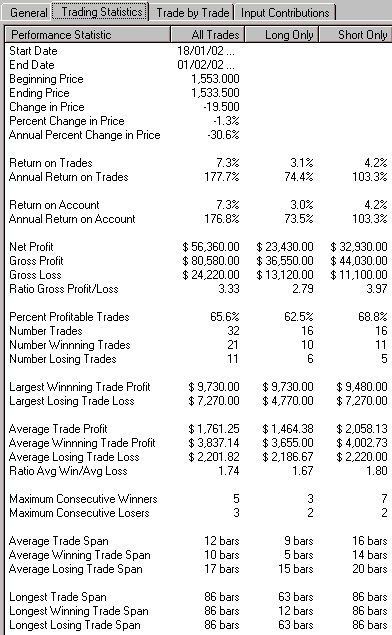
Here is an example using the Trader Optimizer. The main inputs are the distance of the current bar to the upper and lower bands. A RSIV input is added to better differentiate overbought /oversold situations.
(Note: we have developed band indicators. Please contact us for details.)

The prediction uses one month training set (10min bars), and a 2-week walk-forward period, with commission, slippage, etc...


Not too bad...